What restaurant financial reports and KPIs should owners monitor?
Restaurant owners should track daily sales, P&L, balance sheet, cash flow, inventory, labor, prime cost, margins, and menu profitability. These reports help owners see problems early, protect cash, control food and labor costs, and make faster pricing, staffing, and purchasing decisions. Restaurants
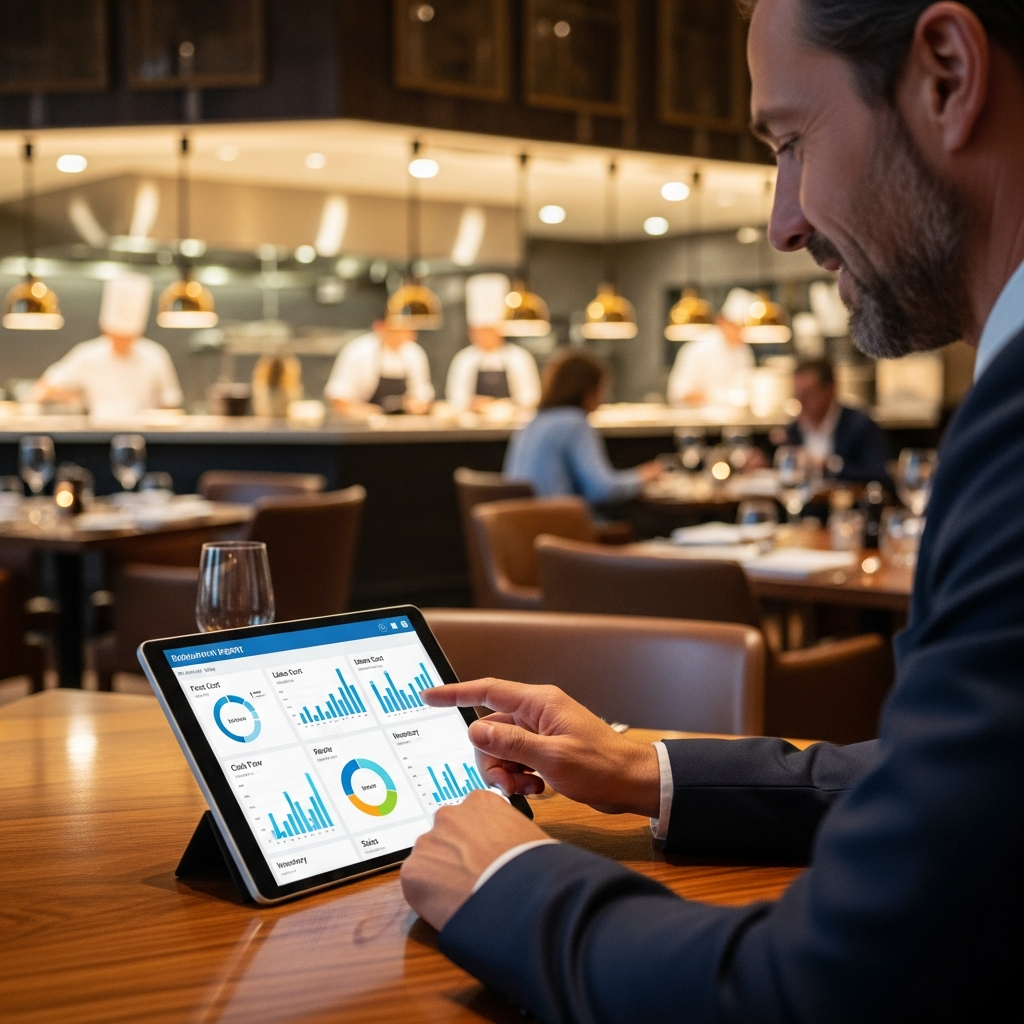
Restaurant owners should track daily sales, P&L, balance sheet, cash flow, inventory, labor, prime cost, margins, and menu profitability. These reports help owners see problems early, protect cash, control food and labor costs, and make faster pricing, staffing, and purchasing decisions.
Restaurants operate in one of the most financially sensitive business environments. Small changes in food prices, labor scheduling, sales mix, or cash timing can quickly turn profit into loss. This article explains the financial reports and key performance indicators that restaurant owners, general managers, controllers, and multi-unit operators should monitor to protect margins and make faster decisions.
It moves from core accounting reports to operational metrics, reporting cadence, technology integrations, and action frameworks. The goal is to show how disciplined measurement turns daily restaurant activity into better pricing, smarter staffing, tighter purchasing, and stronger cash flow.
Why does restaurant financial visibility matter now?
Restaurant financial visibility matters because margins are thin, costs change fast, and problems can build in days. Owners need quick access to sales, labor, inventory, prime cost, and cash data so they can act before waste, overstaffing, discounts, or vendor price increases hurt profit.
In 2026, restaurants remain a low-margin, high-variability business. Many operators still net roughly 3% to 5%, and delivery-channel costs are often cited in the 15% to 30% range, so small swings in pricing, portions, staffing, or channel mix can erase restaurant profitability quickly.
Elevated food and labor inputs continue to pressure margins. In many cases, restaurants need price increases just to hold the same profit level.
That environment makes monthly bookkeeping alone too slow. Rising food cost, overstaffing, theft, waste, discount leakage, and cash shortages can form inside a week. Restaurant financial reports and restaurant KPIs must create “financial visibility,” which means seeing sales, prime cost, inventory, labor, and cash flow management signals fast enough to act.
Operators are shifting from end-of-month P&L reviews to near real-time dashboards fed by POS and back-office tools.
In restaurant accounting, cash-basis reporting shows liquidity by recording income and expenses when money moves. Accrual reporting better matches revenue and costs, including payables and inventory, for a truer view of profit. Many restaurants use accrual accounting to reflect inventory and obligations more accurately.
Start by watching sales, prime cost, and cash position. Then build outward into the core reports every restaurant should produce.
What core financial reports should every restaurant produce?
Every restaurant should produce a P&L, balance sheet, cash flow statement, weekly cash report, daily sales summary, inventory and COGS report, labor report, and owner dashboard. Together, these reports show profit, liquidity, sales trends, cost control, staffing performance, and operational risk.
How should a restaurant P&L be used?
A restaurant P&L should show whether sales are turning into profit after food, beverage, labor, operating costs, and occupancy costs. Owners should review each line as a percent of sales and compare results with budget, prior year, month-to-date, and year-to-date trends.
The Profit and Loss (P&L) is the profitability “map” for decisions like pricing, purchasing, and staffing. Organize revenue by channel and category. Then subtract food and beverage COGS, labor, controllable operating expenses, occupancy, and arrive at operating profit or EBITDA, if used, and net profit.
Review every line as a percent of sales and run variance against budget, prior year, and MTD/YTD to spot drift early.
Why do restaurants need a balance sheet and cash flow report?
Restaurants need a balance sheet and cash flow report because profit does not always mean cash is available. These reports show cash, inventory, payables, taxes, debt, and timing gaps that can create stress even when the P&L looks healthy.
The balance sheet prevents “profitable but broke” surprises by tracking cash, receivables, inventory, prepaids, accounts payable, sales-tax payable, debt, and equity. Payroll, rent, taxes, and vendor terms can create liquidity stress even when the P&L looks fine.
The cash flow statement explains cash movement across operating, investing, and financing activities. A weekly cash report turns that information into a forward view of obligations and runway.
What operational reports should restaurants review daily and weekly?
Restaurants should review daily sales, discounts, voids, refunds, payment types, labor by shift, inventory movement, and COGS variance. These reports connect front-of-house activity with back-office results, helping managers find leakage, waste, theft, overstaffing, and deposit errors.
Operationally, the daily sales summary should break out sales by daypart and channel, covers, discounts, voids, comps, refunds, and payment types. This helps detect leakage and reconcile deposits.
Inventory and COGS reports tie counts and purchases to actual usage. Then they compare theoretical vs. actual cost to pinpoint waste, theft, and portion variance.
Labor reports by role, shift, and daypart, including overtime, connect scheduling to sales and keep labor percent accountable.
An executive dashboard should summarize the “owner actions” and, most importantly, make sure POS, inventory, payroll, and accounting numbers reconcile to one clear story.
What restaurant metrics and benchmarks should operators track?
Restaurant operators should track prime cost, food cost, beverage cost, labor cost, sales per labor hour, gross margin, net margin, average check, revenue per cover, table turns, cash ratios, debt ratios, and item-level contribution margin. Benchmarks help, but trendlines matter most.
What is prime cost in a restaurant?
Prime cost is the combined cost of food, beverage, and labor compared with total sales. It is one of the fastest health checks because it measures the two biggest controllable expense groups and shows whether operations are staying within margin targets.
Prime cost is the fastest health check because it bundles the two biggest controllable buckets: COGS and labor.
Prime Cost % = (Food COGS + Beverage COGS + Total Labor) ÷ Total Sales
Many operators watch for a broad target near 60% to 65%, but concept, service model, and wage structure can push that range up or down.
How should restaurants track food cost and beverage cost?
Restaurants should track food cost and beverage cost by dividing each category’s COGS by its category sales. These percentages show whether purchasing, pricing, recipes, portioning, storage, and waste controls are working as planned.
Food cost % and beverage cost % quantify purchasing and execution discipline.
Cost % = Category COGS ÷ Category Sales
A common food benchmark is roughly 28% to 35%. NetSuite also cites category norms like about 30% for food and lower ranges for beverage.
Variance usually traces to portioning, waste or spoilage, theft, vendor price drift, recipe inaccuracies, or weak inventory counts.
How should restaurants measure labor cost?
Restaurants should measure labor cost as total labor divided by total sales, then pair it with sales per labor hour, overtime rate, and schedule adherence. This keeps staffing tied to demand without hurting service quality.
Labor cost % is calculated as:
Total Labor ÷ Total Sales
Restaurants often target labor cost around 25% to 35%. Pair labor cost with productivity metrics:
Sales per Labor Hour = Sales ÷ Labor Hours
Also track overtime rate and schedule adherence so managers can staff by daypart, protect service, and avoid “panic labor”.
Which profitability and throughput KPIs matter most?
The most useful profitability and throughput KPIs are gross margin, net margin, average check, revenue per cover, revenue per seat, and table turns. These numbers help separate pricing problems from traffic, capacity, and service-speed issues.
Profitability and throughput connect the financial story:
Gross Margin = (Sales − COGS) ÷ Sales
Net Margin = Net Income ÷ Sales
Also track average check, revenue per cover, revenue per seat, and table turns. These metrics help separate pricing problems from capacity constraints.
Which cash, debt, and menu metrics strengthen restaurant resilience?
Cash, debt, and menu metrics help restaurants survive slow weeks and make better menu choices. Track days cash on hand, current ratio, debt-to-equity, fixed-charge coverage, and item-level contribution margin to protect liquidity and improve menu profit.
Add resilience metrics to understand whether the restaurant can handle slow sales, vendor pressure, rent, debt, and capital needs:
Days Cash on Hand = Cash ÷ Avg Daily Operating Expense
Current Ratio = Current Assets ÷ Current Liabilities
Debt-to-Equity = Liabilities ÷ Equity
Track fixed-charge coverage to understand rent and interest burden.
At the menu-item level, contribution margin is:
Price − Item Variable Cost
Menu engineering uses margin and popularity to classify items, such as “stars” and “dogs,” for repricing, promotion, redesign, or removal. Treat benchmarks as starting ranges. Validate them against your own trendline, budget, concept, market, and true peers.
How do restaurants turn reporting into action with cadence, technology, and playbooks?
Restaurants turn reporting into action by using a fixed review cadence, clear ownership, integrated systems, and simple playbooks. Daily checks guide shift decisions, weekly reviews catch cost and cash issues, and monthly close routines confirm the full financial story.
How often should restaurant reports be reviewed?
Restaurants should review sales and labor daily, prime cost signals and cash weekly, full financial statements monthly, and pricing, staffing, vendor terms, capital, and debt needs quarterly. This cadence keeps managers focused on timely action instead of late corrections.
Operational control comes from a fixed cadence. Daily, review sales and covers, discounts and voids, cash deposits, and labor pacing so managers can correct the shift, not the month.
Weekly, run a “flash” view of prime cost signals, inventory variance, A/P due dates, and a short cash forecast to spot issues early.
Monthly, finalize the P&L, balance sheet, cash flow, reconciliations, and budget or trend variance. Quarterly, revalidate pricing, vendor terms, staffing models, capital needs, and debt needs.
Who should own restaurant financial reporting?
Restaurant financial reporting should have clear owners. Owners set targets, general managers drive daily and weekly action, chef and bar leaders control recipes and purchasing, and accounting teams manage coding, approvals, reconciliations, accruals, payroll journals, and close.
Governance prevents “good numbers, bad decisions.” Owners set targets. The GM drives daily pace and weekly actions. The chef and bar manager own recipe standards, purchasing, and variance. The controller or bookkeeper owns coding rules, approvals, reconciliations, and close work, including AP review, accruals, payroll journals, and 3-way match.
Common pitfalls include siloed systems, miscoded invoices, cash-vs.-accrual timing confusion, inconsistent inventory counts, and KPI tunnel vision.
How can technology improve restaurant financial reporting?
Technology improves restaurant financial reporting by connecting POS, inventory, purchasing, scheduling, payroll, accounting, and BI dashboards. Integrated systems reduce manual errors, update recipe and vendor costs faster, trigger alerts, and help managers forecast labor, ordering, and cash needs.
Integrated tech links POS → inventory/purchasing → scheduling/payroll → accounting → BI dashboards. This automates imports, triggers variance alerts, and keeps recipe costs and vendor prices current.
POS-accounting integration can reduce manual posting errors and help teams reconcile faster.
AI trends add forecast models that use patterns and outside factors, such as weather and events, to recommend ordering and staffing scenarios. These tools only work well when master data and close discipline are clean.
What playbook should restaurants use to act on KPIs?
Restaurants should use a simple KPI playbook that standardizes accounting, checks daily sales and labor, reviews prime cost weekly, forecasts cash, reconciles inventory, tests staffing changes, improves menu contribution margin, and holds monthly financial review meetings.
- Standardize the chart of accounts and invoice coding/approvals.
- Publish a daily sales and labor pace report.
- Set prime cost guardrails and hold a weekly “flash” review.
- Build a rolling 13-week cash forecast and manage A/P by due date.
- Reconcile inventory to COGS and investigate variance.
- Review labor by daypart and test staffing changes.
- Start item-level contribution margin actions.
- Benchmark results, then hold a monthly financial review meeting.
Reporting is not accounting for its own sake. It is a repeatable system for faster decisions that protect profit, cash, and long-term resilience.
What is the bottom line on restaurant financial reporting?
Restaurant profitability depends on timely visibility into the numbers that matter most. A clean report stack, steady review cadence, clear ownership, and integrated systems help restaurants move from reactive bookkeeping to proactive management that improves pricing, staffing, purchasing, and cash flow.
The essential foundation is a clean P&L, balance sheet, cash flow report, daily sales summary, inventory reporting, labor reporting, and concise KPI dashboard. The most important metric is prime cost because it captures the two largest controllable expenses: food and labor.
Operators should review sales daily, cost trends weekly, and full financial statements monthly. When integrated POS, inventory, payroll, and accounting systems support these routines, restaurants can improve menu decisions, scheduling, pricing, purchasing, and long-term financial resilience.
For assistance or support with financial reports and KPI's, R365 implementations, automations, menu engineering, accounting, inventory and recipes, HR & Payroll, sales taxes, compliance, or other accounting related tasks in your restaurant locations, contact FORCS. They are experts in R365 and professional Accounting and Operations Support!
Sources
- 7shifts - How to Manage & Calculate Your Restaurant Labor Cost Percentage. Accessed April 25, 2026.
- Aced Solutions - Reporting Schedule. Accessed April 25, 2026.
- Allianz Trade - Debt to Equity Ratio: Definition, Formula, & Importance. Accessed April 25, 2026.
- Aprio - Stop Managing in the Rearview Mirror: Why a Weekly Financial Cadence Is the New Standard for Restaurants. Accessed April 25, 2026.
- Bank of America - Cash vs. Accrual-Basis Accounting: What’s Best for My Small Business?. Accessed April 25, 2026.
- BEP Backoffice - Restaurant Cash Flow Management: What Every Restaurant Leader Needs to Know. Accessed April 25, 2026.
- ChowNow - Guide to Restaurant Food Cost to Improve Profitability. Accessed April 25, 2026.
- Corporate Finance Institute - Fixed-Charge Coverage Ratio (FCCR). Accessed April 25, 2026.
- Crunchtime - Explaining Actual vs. Theoretical Food Cost Variance. Accessed April 25, 2026.
- Crunchtime - What Is AI Forecasting and How Can It Improve Restaurant Operations?. Accessed April 25, 2026.
- FoodMarketHub - The Average Restaurant Food Cost Percentage and How to Optimise It. Accessed April 25, 2026.
- Founders CPA - Restaurant Daily Sales Report: Everything You Need to Know. Accessed April 25, 2026.
- Lightspeed - A Guide on Restaurant Metrics for Owners and Managers. Accessed April 25, 2026.
- Meez - Food Cost Percentage vs. Contribution Margin. Accessed April 25, 2026.
- National Restaurant Association - Elevated Costs Continue to Pressure Restaurant Profitability. Accessed April 25, 2026.
- NCCO - Restaurant Technology Investments Pay Off Fast. Accessed April 25, 2026.
- NetSuite - Restaurant Balance Sheet: What It Is and Why It Matters. Accessed April 25, 2026.
- NetSuite - Restaurant Benchmarks. Accessed April 25, 2026.
- Peppr - Restaurant Profit Margin Guide: 2025 Benchmarks & Strategies. Accessed April 25, 2026.
- RASI - Understanding the Function of Your Restaurant’s Cash Flow Statement. Accessed April 25, 2026.
- RASI - Why You Need to Integrate Your POS System and Accounting Software. Accessed April 25, 2026.
- Restaurant365 - Essential Restaurant Tech for Modern Restaurants. Accessed April 25, 2026.
- Restaurant365 - Daily, Weekly, Monthly, Quarterly Tasks (Accounting & Operations). Accessed April 25, 2026.
- Restaurant365 - How to Calculate Labor Cost Percentage. Accessed April 25, 2026.
- Restaurant365 - How to Calculate Prime Cost in a Restaurant. Accessed April 25, 2026.
- RockStar Data - 7 Essential Financial Ratios: Bar and Restaurants. Accessed April 25, 2026.
- Sage - What Every Restaurant Operator Needs to Know About Prime Cost. Accessed April 25, 2026.
- Scale CPA - Accrual vs. Cash Accounting for Restaurants: Choosing the Right Method. Accessed April 25, 2026.
- SpotOn - How to Read a Restaurant P&L. Accessed April 25, 2026.
- Square - Summer Restaurant Report 2025. Accessed April 25, 2026.
- Tenzo - The Secret to Menu Engineering: Contribution Margins. Accessed April 25, 2026.
- The Restaurant CFO - Restaurant Month-End Close Accounting Checklist. Accessed April 25, 2026.
- Wall Street Prep - Days Cash on Hand. Accessed April 25, 2026.
- Yelp - Restaurant Labor Cost Percentage: Red Flags and Ways to Improve. Accessed April 25, 2026.